Tag Archives: troubleshooting

Cannot Generate SSPI Context

I woke up pretty early this morning and decided to get something in my dev environment worked out that I’ve been meaning to do for a long time now. I needed to put my main Minion dev box on a domain acct for SQL. It was currently running under local system. So I switched it to use the domain acct SQLSvc. The second I restarted SQL with the new acct I got the dreaded “Cannot Generate SSPI Context”.

Here’s my fix and I’m hoping it’ll help someone in the future.

First let me say that SSPI errors can be caused by a number of things. This one turned out to be an SPN error, but it doesn’t have to be. Among other things it could be:

  1. DNS lookup.
  2. SQL Server time out of sync .
  3. Client time out of sync.
  4. Anything else that keeps Kerberos from working.


Now there are also things that can keep the SPN from being created or used. The account could not have the perms it needs to create the SPN in AD, or there could be duplicate SPNs. You can only have 1. Or you could simply have the wrong SPN. Make no mistake, this issue had caused many gray hairs in many DBAs, and I personally always sigh when it comes up because it can be fixed in 5mins or it can take 4 days and 3 MS support techs getting involved. Most of the time though, it’s more straight forward than that. I’m not going to even attempt to make this a treatise on troubleshooting every aspect of this error though. I’m just going to show you how to diagnose the SPN portion of it and quite often that’s the issue so if it doesn’t work for you it’ll at least eliminate the SPN and you can concentrate your efforts on something else.

OK, that’s enough prelim stuff, let’s get to it.

First, we need to see what SPNs we have on the box. There are 2 ways you can do that depending on what rights you have in the domain. I’m going to show you both of them so you can have a visual guide as well as a cmdline guide.

To see what SPNs you have on the box, go to the cmdline and type the following:

SETSPN –L MinionDevCon

What I’m saying here is to list (-L) the SPNs registered for the SQL box I’m interested in. In this case, MinionDevCon.

See below for the query and the results.

SPN1

Also, notice that the SETSPN command isn’t case sensitive.

So above you can see that I’ve got 2 SPNs for my SQL acct on that box.  Now we just have to delete one of them.  However, before we fix this issue, I’ll show you another way to view the same info.

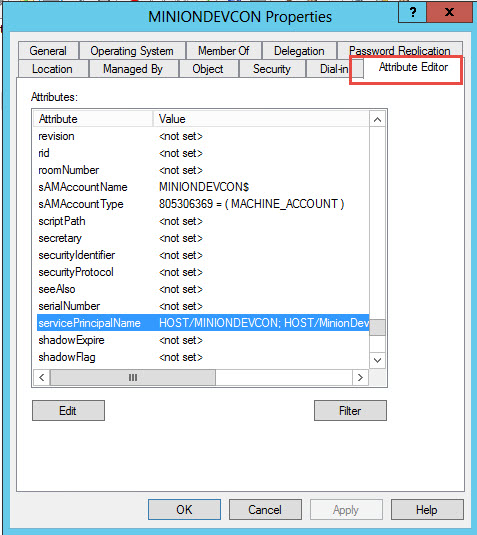
If you have access to AD, then you can also see the SPNs in the computer object properties.  So go to AD and navigate to the computer object for your SQL box.  Again, in my case this is MinionDevCon.  Then go into the properties of that computer object.  You’ll want to go to the Attribute Editor tab.

SPN2

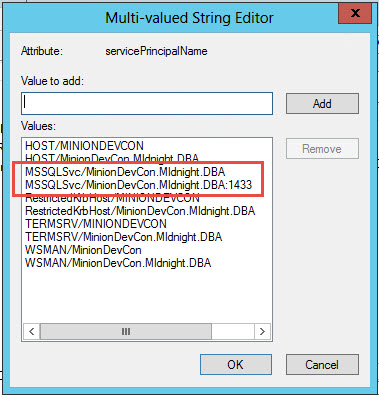
Now find servicePrincipalName and either double-click it or highlight it and hit Edit.  This will show you the list of SPNs for that computer object.

Here you can see my 2 SPNs just like at the cmdline.

SPN3

Deleting the extra SPN:

Deleting the bad SPN is a fairly straight forward operation.  And again I’ll show you 2 ways.

At the cmdline, simply use the SETSPN cmd again and pass in the delete flag.

SETSPN -D MSSQLSvc/MinionDevCon.MIdnight.DBA:1433 MinionDevCon

So again, that’s SETSPN <SPN> <Computername>
The SPN in the cmd above should be exactly the way it was represented in the list when it was queried.  Here’s the command in the query window so you can see what it looks like:

SPN4

Ahhh, see there, my regular acct doesn’t have rights to do this.  I wanted you to see what happens when you don’t have rights.  You will quite often need to get your AD guys to do this for you.  So if you just prepare the cmd and send it to them they’ll be able to make it happen.  Here’s what it looks like when I log in under my domain admin acct.

SPN5

And again, that cmd is simple.  Call SETSPN with the -D flag, which tells it to delete.  Then the exact name of the SPN followed by the name of the server.

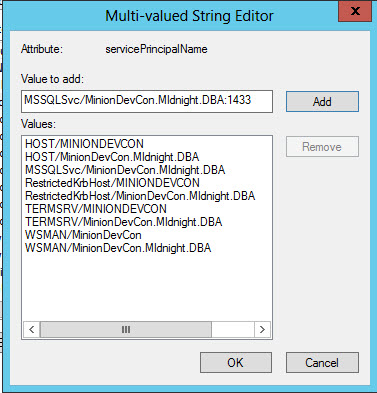
Now let’s do the same thing in AD.  So you’re still in your computer object properties like above.  Simply highlight the SPN you want to drop and then click the Remove button.  It’ll put it in the text box above, but just click OK and it’ll be gone.

SPN6

Ok, that’s it.  I didn’t have to restart my SQL service, but I’ve heard of people who have.

Now, this was just a quick tutorial on how to manage SPNs.  This hole can go pretty deep.  Here’s a decent link on MSDN for troubleshooting SPNs.  I don’t think I like their troubleshooting because they don’t really do a good job of showing you the commands, but it’s a good explanation of the problem, what an SPN is, etc.  If I remember correctly it’ll also help you choose the right SPN.

Replication Error: The ALTER TABLE statement conflicted with the FOREIGN KEY constraint.

I was initializing a transactional replication with a snapshot today and I got the following error:

The ALTER TABLE statement conflicted with the FOREIGN KEY constraint “FK_Table_xxxx”. The conflict occurred in database “DestDB”, table “dbo.MyTable”, column ‘MyColId’. (Source: MSSQLServer, Error number: 547)

This stopped the snapshot from being applied.
I searched for that FK in the DB and it didn’t exist… not on that table, not anywhere.

I’m going to keep this short. The answer is that SQL keeps a copy of FKs in dbo.MSsavedForeignKeys.
So if you get this error, you can go to the subr DB and delete the row from that table and you should be fine.
I had the problem where it kept finding new FKs to error on.
I finally just deleted all the rows out of that table and everything was fine after that.
The actual delete stmt I ran was:
delete dbo.MSsavedForeignKeys where constraint_name = N’FKName’

I hope this saves you a lot of looking around.

Another connection is already running ‘sp_replcmds’ for Change Data Capture in the current database

I recently got this error message in a CDC scenario. There are 2 places you can discover this. You can look at the job history for your CDC capture job, and you can look in sys.dm_cdc_errors.

Since CDC uses the replication log reader repl rules apply here in that you can only have one process running sp_replcmds at once. And in the case of CDC and repl, that’ll be the log reader.

That said, how did this happen to begin with? Well in my case I think what happened was another DBA noticed that the log had gotten up to 6GB and never came down. Log backups were running every hour so over the course of a couple weeks it should have cleared out all the xact, but for some reason it didn’t. For some reason there were still 6GB in the log that remained active. So what I think happened is the other DBA stopped the CDC capture job and ran sp_repldone to clear things out. Now this is where the mistake came about. He didn’t run sp_replflush afterwards and he didn’t disconnect his session. I suspected this may be the case so all I did was disconnect his session and restart the CDC capture job and it started up again right away.

Now, to my knowledge there wasn’t anything I could have done to know which connection it was because he had run a few other things since then and his inputbuffer was misleading. The only thing that let me know which spid to kill was the fact I knew who probably did something like that.

Anyway, I don’t know how to tell you to find the offending user in a case like this where it’s just left over from a previous query in the same connection. But at least you know what you need to do now so you can make your own guesses as to who it is. If anyone has a better way to find this info I’d love to hear it.

Log Management Made Easy

Hey guys… I wrote a nice little log management script I thought some of you might like. It doesn’t do anything to your system so it’s safe to run. Well, I’m turning xp_cmdshell on and off so if you don’t like that then this script isn’t for you.
I’m just putting more info into SQLPERF. These are the most common things I need to know when I have a runaway log. Of course feel free to modify it any way you like. Unfortunately, due to when PS came into play, you can only run this on SQL2K8 boxes and above. If you want to run it on lower boxes you’ll have to take out the PS portion of it.

One more thing before I give you the script. You’re responsible for anything you run on your box. So don’t blame me if something happens and you mess something up. Like I said, I believe this script to be safe but only if you manage the xp_cmdshell portion properly. If you run the script as it is now it’ll turn off xp_cmdshell and if you’ve got processes that rely on it then they will fail. So just be warned yet again that this is a risk. And the reason I’m turning it off again is because I don’t want to open up anything on your box that shouldn’t be. But I really like having the extra info so I don’t have to go look it up. I hope you do too.

Some important notes about the script:
1. It gives you the physical location of the log files, so if there’s more than 1 you’ll see more than 1 entry for each DB.
2. The ShrinkCmd has a variable at the top used to control its default. I like to shrink down to 1GB a lot of times, but set this to whatever you like.
3. You can expand this for yourself in ways I can’t do for you. For instance you could tie it to your log backup job to see when the last execution was and if it failed.
4. I’ve added the last log backup date for you… you’re welcome.
5. The nature of how PS works, you have to change the instance name at the top to the current instance you’re working with. There’s nothing I could do about that. I tried to make it as simple as possible.
6. The PS portion relies on xp_cmdshell. However, I turn it on and off for you in the script. If you want it left on, make sure you comment that portion out of the code or you could have stuff that breaks because you just turned on xp_cmdshell.

declare @LogSize int,
		@Instance varchar(100)
SET @LogSize = 1024
 
SET @Instance = 'localhost\default' -- If default instance then put Default ex: 'MyServer\default'
 
SET NOCOUNT ON
 
CREATE TABLE #LogSpace
(
DBName varchar(100),
LogSizeInMB float,
LogSpaceUsedInPCT real,
Status tinyint
)
INSERT #LogSpace
EXEC ('dbcc sqlperf(logspace)')
 
 
CREATE TABLE ##LogSpacePSTemp
(
DBName varchar(100),
LogBackupDate varchar(25)
)
 
exec sp_configure 'show advanced options', 1
reconfigure
 
exec sp_configure 'xp_cmdshell', 1
reconfigure
 
declare @cmd nvarchar(2000)
		SET @cmd = 'sqlps "cd sqlserver:\sql\' + @Instance + '\databases; $a = dir; foreach($DB in $a){$DBName = $DB.Name; $LogBackupDate = $DB.LastLogBackupDate; invoke-sqlcmd -query ""INSERT ##LogSpacePSTemp SELECT ''$DBName'', ''$LogBackupDate''""" -SuppressProviderContextWarning}"'
 
		--PRINT @cmd
		exec xp_cmdshell @cmd, no_output


select 
LS.DBName
, LS.LogSizeInMB
, LS.LogSpaceUsedInPCT
, D.log_reuse_wait_desc as LogReuseWait
, LT.LogBackupDate as LastLogBackup
, DATEDIFF(mm, LT.LogBackupDate, getdate()) as MinsSinceLastLogBackup
, D.recovery_model_desc as RecoveryModel
, MF.physical_name 
, 'USE [' + D.name + ']; DBCC SHRINKFILE([' + MF.name + '], ' + CAST(@LogSize as varchar(10)) + ')' as ShrinkCmd
from #LogSpace LS
INNER JOIN master.sys.databases D
ON D.Name = LS.DBName
INNER JOIN master.sys.master_files MF
ON D.database_id = MF.database_id
INNER JOIN ##LogSpacePSTemp LT
ON LT.DBName = LS.DBName
ORDER BY LS.LogSizeInMB DESC
 
drop table #LogSpace
drop table ##LogSpacePSTemp
 
exec sp_configure 'xp_cmdshell', 0
reconfigure
exec sp_configure 'show advanced options', 0
reconfigure reconfigure 

T-SQL Tuesday: A file delete exercise

This is my submission for T-SQL Tuesday on Files and filegroups.  You can find the blog tsql2sday.


One of the things I’m known for in the shops I work in is giving my DBAs some interesting exercises.  And sometimes they even come with prizes.  This is an exercise I’ve been giving off and on for a few years now.  I typically point them to a test server and send them to the MyDocs folder under one of the profiles.  In there is a list of files that I want them to delete.  Typically the email has similar verbiage to this:


I have an assignment for you guys.  I want you to go to the following location and delete this list of files.

And whoever gets to that server first and deletes those files first gets their pick of these 3 books.


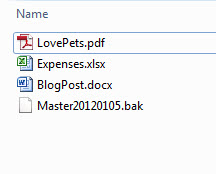
They always rush to be the first there and I can hear their initial failure one at a time as they find out it’s not just an exercise in speed.  Just for fun, here’s a screenshot of the files I have them delete.

 FileList

About that time I follow-up with another email.  It says:

You’ve just discovered that the files cannot be easily deleted.  The only hint I’ll give you is that I did it by highlighting a feature in the new version of SQL Server. 

Good luck.


For a few years now, the race has been whoever could find the obscure setting in filestream the fastest (because they figure that’s the best place to go).  There has to be something in filestream that’s doing it.  So they dig through everything filestream-related they can find.  They dig and they dig and they dig.  They put together some test DBs and do their best to recreate the issue.  I hear all kinds of wacky theories flying around.  But they never hit that magic bullet that makes it all come together (if you don’t mind me mixing metaphors).

It typically takes them 2-3 days before they give up for good.  I’ll tell you something… in the years I’ve been doing this I’ve never had anyone actually get it with no prompting.  So then at the end, we come together and talk about the process they went through to troubleshoot this issue and their reasoning.  They talk about handles and locked files and permissions, and all the new features in SQL Server that would cause something like that, but they’re just not sure because they couldn’t find anything on google and they don’t know the undocumented XPs, etc. 

And as it turns out, this exercise has nothing to do with the files at all.  I mean, it does, but it’s really meant to serve a much greater purpose.  I want to teach them that the customer always lies, or does his best to throw you off track by sprinkling whatever piece of misinformation he has into his request.  And you never know what they’ll do to their systems.  I want to teach them the following things:

  1. Listen to the wording.
  2. Users lie.
  3. Think for yourself, don’t get distracted by what they tell you.
  4. Ask Questions… for the love of GOD ask questions.


So what’s the resolution?  Tell ya what, I’ll give you the code to repro it and that’ll tell you what the issue is.

create database UserDB

on

(

name=UserDB1,

filename=’c:\users\sean.midnight\my documents\Master20120105.bak’

),


(

name=UserDB2,

filename=’ c:\users\sean.midnight\my documents\BlogPost.docx’

),

(

name=UserDB3,

filename=’ c:\users\sean.midnight\my documents\Expenses.xlsx’

)

logon

(

name=UserDBLog,

filename=’ c:\users\sean.midnight\my documents\LovePets.pdf’

)


It’s not always exactly like that, but this is one variation of it.  Now, you may wanna say that I lied, but didn’t.  What I said was that this hinged on a feature in the new version of SQL Server.  But I didn’t say it was a new feature.  It is in fact a feature in the new SQL Server, it just so happens to be a feature of all of them (well, most of them).  And that feature is the ability to create DB files of any name and any extension you like.

Happy T-SQL Tuesday, and I hope this fits in with the theme.

Cluster Upgrade Error: 19019

So we upgraded a cluster from 2008 to R2 tonight.  We upgraded the inactive node to R2 SP2 and then went to failover the cluster so we could upgrade the other node.  But when we tried to failover it failed.  The only thing the critical events for the resource said was that it couldn’t failover.  So no help there.  The only other error was in the event viewer and it said that the shared component upgrade failed… even though nothing in the upgrade process failed.  There actually were other errors in the event viewer but I’ll let the link below cover those.  The big important error was Error:  19019.

I remembered something from a few yrs ago that involved a registry fix so I started looking at the registry.  After opening regedit I went to the most logical place:

HKLM\Software\Microsoft\Microsoft SQL Server\MSSQL10_50.SQL2008

Once there I saw the Setup folder, which seemed like a good place to start.  Inside there I saw a key called SQLDataRoot and its value started with E:\

Well, I have a pretty standardized environment so I know the SQL root was supposed to be on D:.  I changed the location to D:\ and the SQL Server resource came online instantly. 

So again, that registry key is:

HKLM\Software\Microsoft\Microsoft SQL Server\MSSQL10_50.SQL2008\Setup\SQLDataRoot

This is not only an interesting fix, it’s also a testament to what having a highly standardized environment can do for you.  I could have compared this entry with node1 to see if they matched, but it may not have even been flagged as an issue if we  didn’t always install SQL on D:\.

So once I had the fix in place, I had something to search for, so I went to google to see if I could find anything about it out there.  I came across this great blog post that even gives more detail on this error, so rather than try to reproduce the entire thing here, I’ll just point you to that post. 

http://blogs.msdn.com/b/jorgepc/archive/2010/10/14/onlinethread-sql-cluster-shared-data-upgrade-failed-error-installing-cumulative-update-in-sql-server.aspx

 So this is why I call myself the bumbling DBA.  I don’t actually know anything, but I manage to find my way through solutions somehow.  And I know I’ll get lots of comments on this with everyone telling me they knew this cause they’ve seen it 100x and all I can say is bully for you.  I’ve only seen it once and it was a few yrs ago.  I don’t get out much.

Mystery of the missing files

About 3mos ago I had my work box rebuilt.  The encryption software glitched and it just wouldn’t boot.  So the helpdesk girl was able to slave the drive to another box and copy my files to a NAS.  I looked and all the folders were where they should be.  Great.

She then rebuilt the box and when I got it back I copied all the folders back.  I let it rest and I was very pleased that I was able to preserve all my scripts, etc.  A few days passed and I needed a script, so I went to that folder and it was empty.  WTx dude?  I looked and everything was still out on the NAS so I tried to get it off of there but they were missing there too.    OK, now I’m upset.  I’ve just lost most everything I cared about on my box.  It took me a while to accept it but I finally did.

Well, today (this is now several wks later) I finally went to replace one of the things I lost by downloading it again.  When I went to save it though, it said that it already existed and did I want to replace it.  See, I saved it to the same folder as before because I’m OCD that way.  Needless to say it took me about 2secs to figure out what had happened.  Normally I setup my box the way I want right away, but this time I got busy and just forgot.  And as it turns out my files were there, just hidden.  And I didn’t have ‘show hidden files’ checked in folder properties.  Now that I know the problem, how do I fix it because there’s a lot of files and folders to go through.  The answer of course is Powershell.  I got it right on the first try and the code is so small, and so compact, and so easy to come up with, it just screams PS.  And it is the perfect example of what PS is all about.  So here’s the query I used… enjoy

dir -recurse -force | %{$_.attributes = 'Archive'}

Now, here’s a brief explanation of a couple of the flags.

-recurse — means to run it against all the subfolders too.
-force — this is a good one because it tells PS to show you all the files.  If they’re hidden you won’t see them unless you use this flag.

So that’s it really.  A single line of code to unhide hundreds of files in dozens of folders and subfolders.  And since this is my first day back after vacation, I’d say I’m starting it off on a decent note.

An interesting log truncation case

Here’s a good one for you guys. I got a call from one of my DBAs today that they’re having trouble with the logs on one server not truncating. They’ve brought the server space to a critical level, and it needs to be fixed. The problem is that the DBA had looked at the log backups and they were fine. The log backup job was running just fine, and there were no active transactions.

I asked if there were any DBs being replicated… no.
OK, I’ll look into it.

So I connect and start my investigation where I always do for log truncation problems.
SELECT name, log_reuse_wait_desc from sys.databases

This tells me exactly what the log is waiting for before it can truncate. It’s really a matter what what your goal is. Some people love the troubleshooting process so much that they want to drag it out as long as they can. So they hunt around looking at different things to try to find what the problem is. They gather evidence and try different things until the problem is solved. I’m not that way though. I want to find the issue ASAP and get on to other things. So if you really enjoy the hunt then keep doing what you’re doing. But if you want to solve the problem quickly, then use the above query and get on with your life.

So anyway, the log was waiting on a log backup. I then checked the log backup job and it had been running just fine all day. So ok, the log is being backed up, but SQL still thinks that it’s waiting on a log backup before it can truncate the log.

This is where a knowledge of SQL can come in. At this point there are only 2 things that could architect this situation. Because all the DBs on the server are in the same boat with their logs filling up. So either the backup isn’t actually running, or it’s running with the copy_only flag.

A quick look at the job properties told me exactly what I needed to know. Looking at the execution time of the different runs, the job finishes in about 10secs. That seems a little fast for me on a server that has like 200 DBs on it. So looking back at the history 2 days ago the job was taking 9mins.

At this point, I knew exactly what the problem was. I looked in the SP that runs the backup, and the line that actually runs the backup had been commented out. Someone was trying to make a simple change and commented out the wrong line in the SP.

Look, I’m not smarter than your average DBA, and I’m not necessarily better educated. What I do however, is follow a predictable pattern of troubleshooting, and actually pay attention to the evidence. Sometimes the evidence isn’t clear and you have to make guesses, but most of the time it is.
I understand that the thrill of the hunt keeps you going, but some things are easy enough that you should just get them done. Why a log won’t truncate is such an easy thing to diagnose it should just be commonplace for you. Search somewhere else for your troubleshooting fix.

Tempdb Contention

I had a nice production problem today that slowed everything down drastically.  I’ll spare you the details of the user processes, but when looking in sys.sysprocesses, I noticed that the waitresource was ‘2:%’.  I also correlated this with the wait_type column in dm_os_waiting_tasks and saw a lot of PAGELATCH_UP types. So the first thing I did was pull up the page# in dbcc page, and noticed it was page type 11. 

In my case, here’s what I typed:

DBCC traceon(3604)

DBCC Page(2, 1, 186204, 3)

 And I might add that there were a lot of them backed up.  I had something like 30 blocked processes and they were all waiting on this same page in tempdb.  Page type 11 is a PFS page so this meant I was having contention in tempdb. 

And since I always like the low-hanging fruit, I chose to add more files instead of using -T1118. 

So I added 6 files to the 16 that were already there and the problem cleared up almost instantly.

You don’t have to use DBCC Page though.  As it turns out, I was just surfing around afterwards to see what was out there on this issue , and I found a great blog by MCM Robert Davis that has a lovely query that’ll tell you right away whether you have tempdb contention.  I was gonna paste the query in here, but go read it for yourself.

Getting a good look at deadlocks

One of the things that’s a major concern for DBAs is monitoring deadlocks.  And that’s really easy.  The more difficult part can be to sift through all the info once you’ve got it.  The deadlock graph in Profiler is my favorite tool for gathering them, and I prefer to shred the XML results into a table so I have all the info right there in front of me.

So here I’ve got a script I’ve written that shreds your deadlock XML into a relational table.  Actually, I modified this from the one Trevor Barkhouse did for his deadlocking presentation.  I just wanted some friendlier cols, and more info in the table.  Once you get the data into this format though, you can see how easy it is to turn it into a real process. 

What I love the most about this is how easy it is to go through a high number of deadlocks and query them for anything you like.  You can easily get a picture of your entire environment with very little effort.  Now, for this, you’ll have to get the deadlock graphs into XML to begin with and while I could show it to you here, Trevor does a good job of it so I’ll just point you to his blog on the topic.  However, once you have the XML, then here’s my query to mine it.

Here’s the code:
USE [tempdb];

GO

DECLARE @DeadlockCount INT;
DECLARE @DeadlockGraph XML;
DECLARE @DeadlockGraphFileName NVARCHAR(255);
DECLARE @DynamicSQL NVARCHAR(1024);

   SET @DeadlockGraphFileName = 'G:\DeadlockFiles\DeleteCV3OrderGenerationQueue\AllEvents.xml'
  
--'G:\DeadlockFiles\20110405-20110418_1.xdl';

   -- The OpenRowset() T-SQL function requires a string literal for the file
   -- name, so use dynamic SQL to avoid hardcoding a path (other than in the
   -- above assignment to the @DeadlockGraphFileName variable... but that's
   -- a little clearer).
   SET @DynamicSQL = N'SELECT @XMLDocument = Cast([BulkColumn] AS XML)' +
      
NCHAR(10) +
      
N'FROM OpenRowset' +
      
NCHAR(10) +
      
N'(' +
      
NCHAR(10) +
      
N'    BULK ''' +
      
@DeadlockGraphFileName +
      
N''',' +
      
NCHAR(10) +
      
N'    SINGLE_BLOB' +
      
NCHAR(10) +
      
N') AS [XMLDocument];';

PRINT @DynamicSQL
    
--  Execute the dynamic SQL and pull the result into the @XMLDocument
    --  local variable.
  
EXECUTE [master].[sys].[sp_executesql]
      
@stmt = @DynamicSQL,
      
@params = N'@XMLDocument XML OUTPUT',
      
@XMLDocument = @DeadlockGraph OUTPUT;


--  Count the number of deadlock graphs in the XDL file.
  
SELECT @DeadlockCount = DeadlockList.Graphs.value('count(deadlock)', 'Int')
  
FROM @DeadlockGraph.nodes('/deadlock-list') AS DeadlockList(Graphs);

   PRINT 'File            :   ' +
      
@DeadlockGraphFileName +
      
CHAR(10) +
      
'Deadlock count  :   ' +
      
CAST(@DeadlockCount AS VARCHAR);

    --  Extract the parties to the deadlock.
    
    
DECLARE @PartiesToTheDeadlocks TABLE
(
  
[VictimProcessID] VARCHAR(25),
    
[VictimLastBatchStarted] datetime2,
    
[VictimLockMode] VARCHAR(15),
    
[VictimXActID] VARCHAR(15),
    
[VictimClientApp] VARCHAR(50),
    
    
[LiveProcessID] VARCHAR(25),
    
[LiveLastBatchStarted] NVARCHAR(23),
    
[LiveLockMode] VARCHAR(15),
    
[LiveXActID] VARCHAR(15),
    
[LiveClientApp] VARCHAR(50),
    
    
[LiveFileID] VARCHAR(15),
    
[LivePageID] VARCHAR(15),
    
[LiveObjName] VARCHAR(50),
    
[LiveLockModeHeld] VARCHAR(50),    
    
[VictimLockModeRequest] VARCHAR(50),    
    
    
[VictimFileID] VARCHAR(15),
    
[VictimPageID] VARCHAR(15),
    
[VictimObjName] VARCHAR(50),
    
[VictimLockModeHeld] VARCHAR(50),    
    
[LiveLockModeRequest] VARCHAR(50),
    
    
[VictimProcName] VARCHAR(100),
    
[VictimExecStack] VARCHAR(MAX),
    
[LiveProcName] VARCHAR(100),
    
[LiveExecStack] VARCHAR(MAX),    
    
[VictimInputBuffer] VARCHAR(2048),      
    
[LiveInputBuffer] VARCHAR(2048)

);

    
    INSERT INTO @PartiesToTheDeadlocks
  
SELECT VictimProcessID,
          
VictimLastBatchStarted,
          
VictimLockMode,
          
VictimXActID,
          
VictimClientApp,
          
          
LiveProcessID,
          
LiveLastBatchStarted,
          
LiveLockMode,
          
LiveXActID,
          
LiveClientApp,
          
          
LiveFileID,
          
LivePageID,
          
LiveObjName,
          
LiveLockModeHeld,
          
VictimLockModeRequest,
          
          
VictimFileID,
          
VictimPageID,
          
VictimObjName,
          
VictimLockModeHeld,
          
LiveLockModeRequest,
          
          
VictimProcName,
          
VictimExecStack,
          
LiveProcName,
          
LiveExecStack,
          
VictimInputBuffer,
          
LiveInputBuffer                

   FROM
  
(
  
  
SELECT
  
--Victim
  
DeadlockList.Graphs.value('(process-list/process[1]/@spid)[1]', 'NVarChar(15)') AS VictimProcessID,
  
CAST(REPLACE(DeadlockList.Graphs.value('(process-list/process[1]/@lastbatchstarted)[1]', 'NChar(23)'), N'T', N' ') AS DATETIME) AS VictimLastBatchStarted,
  
DeadlockList.Graphs.value('(process-list/process[1]/@lockMode)[1]', 'NVarChar(15)') AS VictimLockMode,
  
DeadlockList.Graphs.value('(process-list/process[1]/@xactid)[1]', 'NVarChar(15)') AS VictimXActID,
  
DeadlockList.Graphs.value('(process-list/process[1]/@clientapp)[1]', 'NVarChar(50)') AS VictimClientApp,
  
--Live
  
DeadlockList.Graphs.value('(process-list/process[2]/@spid)[1]', 'NVarChar(15)') AS LiveProcessID,
  
CAST(REPLACE(DeadlockList.Graphs.value('(pprocess-list/process[2]/@lastbatchstarted)[1]', 'NChar(23)'), N'T', N' ') AS DATETIME) AS LiveLastBatchStarted,
  
DeadlockList.Graphs.value('(process-list/process[2]/@lockMode)[1]', 'NVarChar(15)') AS LiveLockMode,
  
DeadlockList.Graphs.value('(process-list/process[2]/@xactid)[1]', 'NVarChar(15)') AS LiveXActID,
  
DeadlockList.Graphs.value('(process-list/process[2]/@clientapp)[1]', 'NVarChar(50)') AS LiveClientApp,
  
--Live resource.
  
DeadlockList.Graphs.value('(resource-list/pagelock[1]/@fileid)[1]', 'NVarChar(15)') AS LiveFileID,
  
DeadlockList.Graphs.value('(resource-list/pagelock[1]/@pageid)[1]', 'NVarChar(15)') AS LivePageID,
  
DeadlockList.Graphs.value('(resource-list/pagelock[1]/@objectname)[1]', 'NVarChar(50)') AS LiveObjName,
  
DeadlockList.Graphs.value('(resource-list/pagelock[1]/@mode)[1]', 'NVarChar(50)') AS LiveLockModeHeld,
  
DeadlockList.Graphs.value('(resource-list/pagelock[1]/waiter-list/waiter/@mode)[1]', 'NVarChar(50)') AS VictimLockModeRequest,    
  
--Victim resource.
  
DeadlockList.Graphs.value('(resource-list/pagelock[2]/@fileid)[1]', 'NVarChar(15)') AS VictimFileID,
  
DeadlockList.Graphs.value('(resource-list/pagelock[2]/@pageid)[1]', 'NVarChar(15)') AS VictimPageID,
  
DeadlockList.Graphs.value('(resource-list/pagelock[2]/@objectname)[1]', 'NVarChar(50)') AS VictimObjName,
  
DeadlockList.Graphs.value('(resource-list/pagelock[2]/@mode)[1]', 'NVarChar(50)') AS VictimLockModeHeld,  
  
DeadlockList.Graphs.value('(resource-list/pagelock[2]/waiter-list/waiter/@mode)[1]', 'NVarChar(50)') AS LiveLockModeRequest,
  
--Inputbuffers
  
DeadlockList.Graphs.value('(process-list/process[1]/executionStack/frame/@procname)[1]', 'NVarChar(100)') AS VictimProcName,
  
DeadlockList.Graphs.value('(process-list/process[1]/executionStack/frame)[1]', 'VarChar(max)') AS VictimExecStack,
  
DeadlockList.Graphs.value('(process-list/process[2]/executionStack/frame/@procname)[1]', 'NVarChar(max)') AS LiveProcName,
  
DeadlockList.Graphs.value('(process-list/process[2]/executionStack/frame)[1]', 'VarChar(max)') AS LiveExecStack,
  
RTRIM(LTRIM(REPLACE(DeadlockList.Graphs.value('(process-list/process[1]/inputbuf)[1]', 'NVarChar(2048)'), NCHAR(10), N''))) AS VictimInputBuffer,
RTrim(LTrim(Replace(DeadlockList.Graphs.value('
(process-list/process[2]/inputbuf)[1]', 'NVARCHAR(2048)'), NChar(10), N''))) AS LiveInputBuffer

FROM @DeadlockGraph.nodes('/deadlock-list/deadlock') AS DeadlockList(Graphs)
) AS [_ProcessDetails];

--  Display the parties to the deadlock.
SELECT *
FROM @PartiesToTheDeadlocks
ORDER BY VictimLastBatchStarted, VictimXActID;'

Now, the code formatter messed up the coloring, but the code works. 

Now, I’ll list the cols and explain them cause I know that’s the next thing you’re gonna want.  It’s broken up into 2 categories… the Victim process and the Live process.  I didn’t know what else to call it other than live and still keep it short enough to prefix the cols with.

VictimProcessID – spid of victim.

VictimLastBatchStarted – date/time of last batch for victim.

VictimLockMode – lock held by victim.

VictimXActID – trans ID for victim.

VictimClientApp – Victim client app.

LiveProcessID – spid of live process.

LiveLastBatchStarted – date/time of last batch for live process.

LiveLockMode – lock held by live process.

LiveXActID – trans ID within the batch for victim (I think).

LiveClientApp – client app for live process.

LiveFileID – file ID where the locked resource for live process is held.

LivePageID – page ID the processes are fighting over.  The live process currently holds the lock on this one.

LiveObjName – object the processes are fighting over.  The live process currently holds the lock on this one.

LiveLockModeHeld – lock held on the above object by the live process.

VictimLockModeRequest – lock being requested  on the above object by the victim.

VictimFileID – file ID where the object the victim process is holding is held.

VictimPageID – Page ID the processes are fighting over.  The victim currently holds the lock on this one.

VictimObjName – object the processes are fighting over.  the victim currently holds the lock on this one.

VictimLockModeHeld – lock held on the above object by the victim.

LiveLockModeRequest – lock being requested on the above object by the live process.

VictimProcName – the SP called by the victim.

VictimExecStack – the stmt in the SP that caused the deadlock.

LiveProcName – the SP called by the live process.

LiveExecStack – the stmt in the SP that caused the deadlock.

VictimInputBuffer – the exact SQL that was sent to SQL engine.

LiveInputBuffer – the exact SQL that was sent to SQL engine.

Now you can see at a glance where your problem deadlocks are, how often they’re occurring, and which resources are under the most contention.

Good stuff that.